
In addition to the costs driven by the bond market, regulators impose certain fees based on loan characteristics and they announced a big change to those fees on Thursday.
Exactly which fees are we talking about here?
This refers to Loan Level Price Adjustments (LLPAs) imposed by Fannie Mae and Freddie Mac (the “agencies”), the two entities that guaranty a vast majority of new mortgages. LLPAs are based on loan features such as your credit score, the loan-to-value ratio, occupancy (owner vs non-owner occupied homes), and now after this week’s announcement, your debt-to-income ratio (DTI).
What lenders/loans does this apply to?
Any loan guaranteed by one of the agencies regardless of the lender. This is MOST loans in the US. Examples of loans that wouldn’t be affected would be FHA/VA as well as certain jumbo and specialty products. “Non-conforming” loans are not impacted by this as they are not guaranteed by the agencies. A common example of a non-conforming loan would be a jumbo loan from a retail bank or credit union.
When does this take effect?
This applies to loans that are guaranteed by the agencies starting May 1st, 2023. That means many lenders will begin to implement the changes in March/April.
What changed, in a nutshell?
While you’ll still get the best terms with the highest credit score, the effective penalty for having a credit score under 680 is now smaller than it was. For instance, if you have a score of 659 and are borrowing 75% of the home’s value, you’ll pay a fee equal to 1.5% of the loan balance whereas you’d pay no fee if you had a 780+ credit score. But before these changes, you would have paid a whopping 2.75% fee. On a hypothetical $300k loan, that’s a difference of $3750 in closing costs.
The following table shows LLPAs in terms of percentages of the loan balance. The top row is the loan-to-value ratio (LTV) and the column on the left is credit score (FICO). For instance a FICO of 740-759 with 75-80 LTV would have an LLPA of 0.875% or $875 for every $100k borrowed. The same loan amount on the same property would have an LLPA of 2.75 or $2750 for every $100k if your FICO was 639 or less.
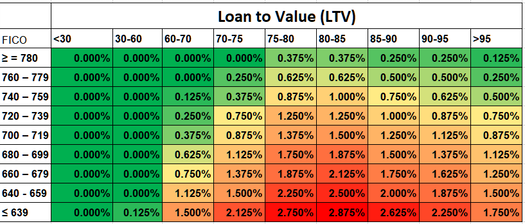
For those wondering why higher LTVs begin to cost less after 85%, part of the reason is the implied presence of mortgage insurance (the higher the LTV, the higher the amount of mortgage insurance coverage required). The other reason is that Fannie and Freddie’s congressional mandate involves fostering affordable housing and promoting home ownership. Their regulator, FHFA said in a statement that these LLPA changes “maintain support for single-family purchase borrowers limited by wealth or income.” In other words, if you can’t afford a big down payment, FHFA is cutting you a break.
That notion is even more apparent when we examine how the LLPA grid changed from the previous version. The biggest improvements in costs were seen in credit scores of 679 and lower. Those improvements were “paid for” by making things more expensive elsewhere in the grid.
Borrowers with higher credit scores will generally be paying a bit more than they were under the previous structure. The following chart shows the differences. Green cells show where things have become more affordable than they were. Red cells = more expensive. All values refer to a percentage of the loan balance charged as an upfront fee. This doesn’t necessarily come out of your pocket upfront as lenders can offer higher interest rates in some cases and pay these costs for you (but the costs are still there, and still technically being paid by you over time in the form of higher interest rates).

There are many other changes that aren’t so easily translated to a heat-map table. The most notable is a new charge for DEBT-TO-INCOME (DTI) ratio. This will be controversial in many scenarios as income calculations can be somewhat subjective and debt calculations can be legitimately “tweaked” with some advanced planning and/or debt consolidation. Nonetheless, every loan guaranteed by the agencies has a DTI attached to it. If yours is over 40% and you’re borrowing more than 60% of your home’s value, you’ll be paying more.
A few other examples of changes:
- There are new credit score bands at 760+ and 780+.
- There is more differentiation in high-balance vs non-high-balance ARM loans (uncommon… most ARMs are not done through the agencies)
- to 2-4 unit property LLPAs moved lower across the board
- There’s a new generic LLPA for “subordinate financing” (a 2nd loan or HELOC) whereas the previous LLPAs were more granular depending on the LTV of first loans vs subordinate loans
- BIG increases in fees for many “Cash-Out” loans
Where can I see the actual, specific changes?
If you have a loan in process or soon will, these changes likely won’t apply to you. Again, most lenders won’t implement them right away. Ask your lender for clarification. If you’re asking them this week, they may not be aware of the changes yet!
The official changes are here:
https://singlefamily.fanniemae.com/media/9391/display
NOTE: at the top of that page, there is a link to the PREVIOUS/EXISTING version of the LLPAs (or you can click here). Just be sure to note the text at the top of whichever page you’re viewing, so you know if it applies to loans before or after 5/1/2023 (and keep in mind that “after 5/1/2023” will refer to most loans originated in March/April).
Who decided that these changes should happen?!
The FHFA. Here’s their statement: https://www.fhfa.gov//Media/PublicAffairs/Pages/FHFA-Announces-Updates-to-Enterprises-SF-Pricing-Framework.aspx
Shifting gears to this week’s economic data and market movement, we received several monthly housing-related reports–several of which suggested the negative momentum may be ebbing or even reversing.
The National Association of Homebuilders posted builder confidence numbers that were 4 points higher than expected and 4 points up from last month.

The Mortgage Bankers Association (MBA) reported a big increase in both purchase and refinance applications relative to last week’s numbers.

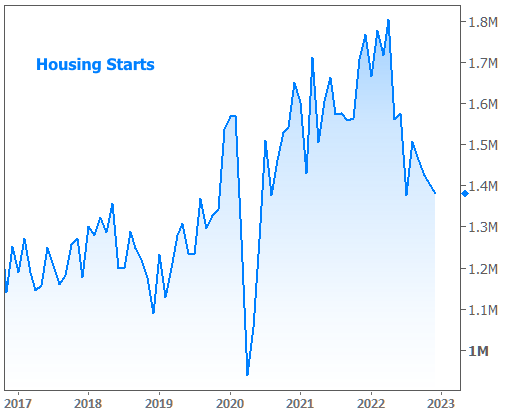
The Commerce Department tallied fewer housing starts this month, but the number beat the median forecast.
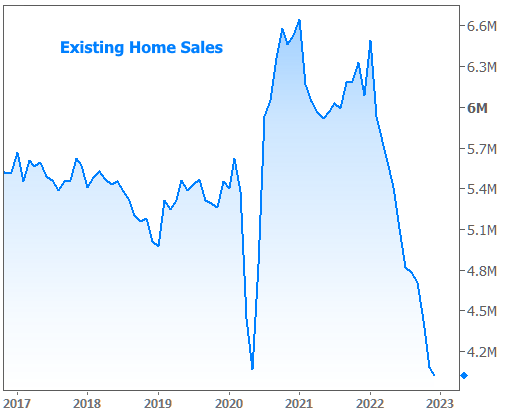
Last by not least, the National Association of Realtors (NAR) reported that Existing Home Sales remained above an annual pace of 4 million units–slightly higher than the 3.96 million expected by analysts.
The bond market put in a mixed performance with improvement on Wednesday resulting in the lowest rates in 4 months. Thursday was fairly flat and Friday saw some deterioration. By the end of the week, trading levels were almost perfectly in line with those seen at the end of last week.